Introduction
Cartograph is a Python package for drawing OpenStreetMap compatible map tiles. The tiles it produces can be viewed as a slippy map or by various apps such as Maverick. The source code is available on Github.
Installation
Cartograph can be installed using pip.
pip install cartograph
Reference
Basic Usage
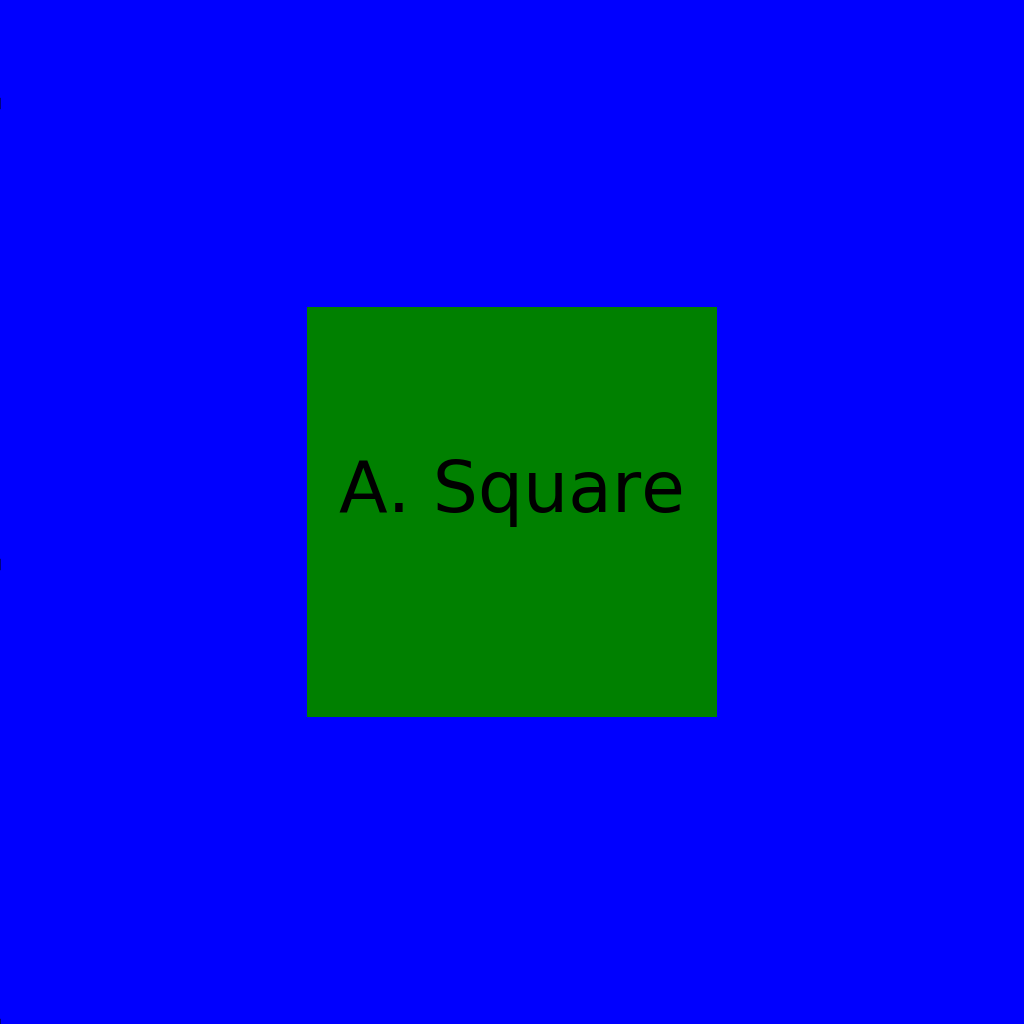
The following script is a minimal demonstration of how to create a map, add some features to it and draw the map as a single image.
from cartograph import Map
from cartograph.style import AreaStyle, NameStyle

map = Map()
map.bound_by_box(0.0, 1.0, 0.0, 1.0) # degrees of latitude / longitude
map.set_background_color('blue')

square = np.array([[0.3, 0.7, 0.7, 0.3], [0.3, 0.3, 0.7, 0.7]]) # degrees of latitude / longitude
square_style = AreaStyle(color='green')
map.add_area(square, square_style)

name = 'A. Square'
location = np.array([0.5, 0.5]) # degrees of latitude / longitude
name_style = NameStyle(fontsize=5)
map.add_name(name, location, name_style)

map.draw_image('map.png')
This should create an image called “map.png” like the one below
Tutorial
There is an extended tutorial to draw maps using OpenStreetMap data, including fetching and processing the data using other Python libraries.