Quick introduction
The steps to draw your own map tiles are broadly:
- Define the map boundaries
- Fetch the OpenStreetMap data
- Process the OpenStreetMap data
- Process the elevation data (optional)
- Draw the map tiles
Before starting we need to install some libraries. We will use this Overpass Python wrapper to fetch the OpenStreetMap data, Osmium to process the OpenStreetMap data and Cartograph to draw the map tiles. All of these libraries can be installed using pip.
pip install overpass osmium cartograph
The files used to create this tutorial are available in the download section.
Define the map boundaries
We start by choosing the zoom levels for which we will draw map tiles. We need to create a Map object and then we can use the bound_by_osm_tiles method to calculate the bounds of the map. The bound_by_osm_tiles method takes a zoom level and one or more pairs of latitude/longitude coordinates and calculates the minimal rectangle of tiles that includes those points.
In this example we will use just a single point and draw the map tile that contains Montreux, a small city in the west of Switzerland. An easy way to find lat/lon coordinates is using the website latlon.net.
from cartograph import Map

places = {'montreux':(46.431094, 6.912817)}

## Define the map boundaries
zoom_levels = (13, 18)
map = Map()
min_x, max_x, min_y, max_y = map.bound_by_osm_tiles(zoom_levels[0], places['montreux'])
Fetch the OpenStreetMap data
Using the Overpass Python wrapper, we can download OSM data for the map area.
import overpass

## Fetch the OSM data
print('Downloading OSM data...')
savename = '%d-%d_%d-%d.osm' % (min_x, max_x, min_y, max_y)
api = overpass.API(endpoint='https://overpass-api.de/api/interpreter', timeout=60)
latlon_bounds = map.get_latlon_bounds()
query = overpass.MapQuery(latlon_bounds[0,0]-0.001,
                          latlon_bounds[1,0]-0.001,
                          latlon_bounds[0,1]+0.001,
                          latlon_bounds[1,1]+0.001)
response = api.get(query, responseformat='xml')
with open(savename, 'w') as file:
    file.write(response)
Processing the OpenStreetMap data
We subclass the SimpleHandler class from Osmium to process the data we need from the OSM data file.
import numpy as np
import osmium
from cartography.style import AreaStyle

class OSM(osmium.SimpleHandler):
    def __init__(self, map):
        osmium.SimpleHandler.__init__(self)

        self.map = map

    def area(self, object):
        if object.tags.get('natural') == 'water':
            for boundary in object.outer_rings():
                curve = np.array([[p.lat, p.lon] for p in boundary]).T
                self.map.add_area(curve, AreaStyle('#88aaffff'))
We can run the handler in the main script.
from parse import OSM

## Process the OSM data
print('Processing OSM data...')
osm = OSM(map)
osm.apply_file(savename, locations=True)
This simple example collects all bodies of water from the OSM data and adds them to the map with a blue colour. A much more complete handler can be found with the other files in the download section. The tags page on the OpenStreetMap wiki may be a useful reference when processing more OSM data. For more style options, consult the documentation and the files in the download section.
Elevation data
Adding elevation data to the map allows us to draw contours and hillshade. You will need to find a source of elevation data for the area you wish to map. The US Geological Survey has Space Shuttle Radar Topography Mission elevation data for the entire world which you can download if you sign up to their website. Several countries also collect their own elevation data, some of which is freely available. Whatever data you use, you need to check carefully what format the data is in and, crucially, what coordinate system it uses. Currently, Cartograph requires the data to be parametrised by latitude and longitude.
I used the DHM200 elevation data for Switzerland, available from the Swiss Federal Office of Topography. It is parametrised using an old Swiss military coordinate system but fortunately the Swiss Federal Office of Topography have a tool on their website which can change the coordinate system to latitude and longitude.
To add the elevation data to the map we use the add_elevation method. Currently, this method expects the data to be an array where each column gives a latitude, longitude and elevation.
from cartograph.style import ElevationStyle

## Elevation data
print('Processing elevation data...')
elevation_data = np.loadtxt('DHM200.txt')
elevation_style = ElevationStyle(contour_appears_at=16,
                                 contour_levels=np.linspace(0,5000,250,endpoint=False),
                                 contour_color='#55008866',
                                 clabel_levelskip=5)
map.add_elevation(elevation_data.T, elevation_style)
Draw the map tiles
Once we have added all the data to the map, all that remains is to draw the map tiles. We can simply use the draw_zoom_levels method to draw all the map tiles for our chosen range of zoom levels.
## Draw map tiles
map.draw_zoom_levels(zoom_levels[0], zoom_levels[1], disp=True)
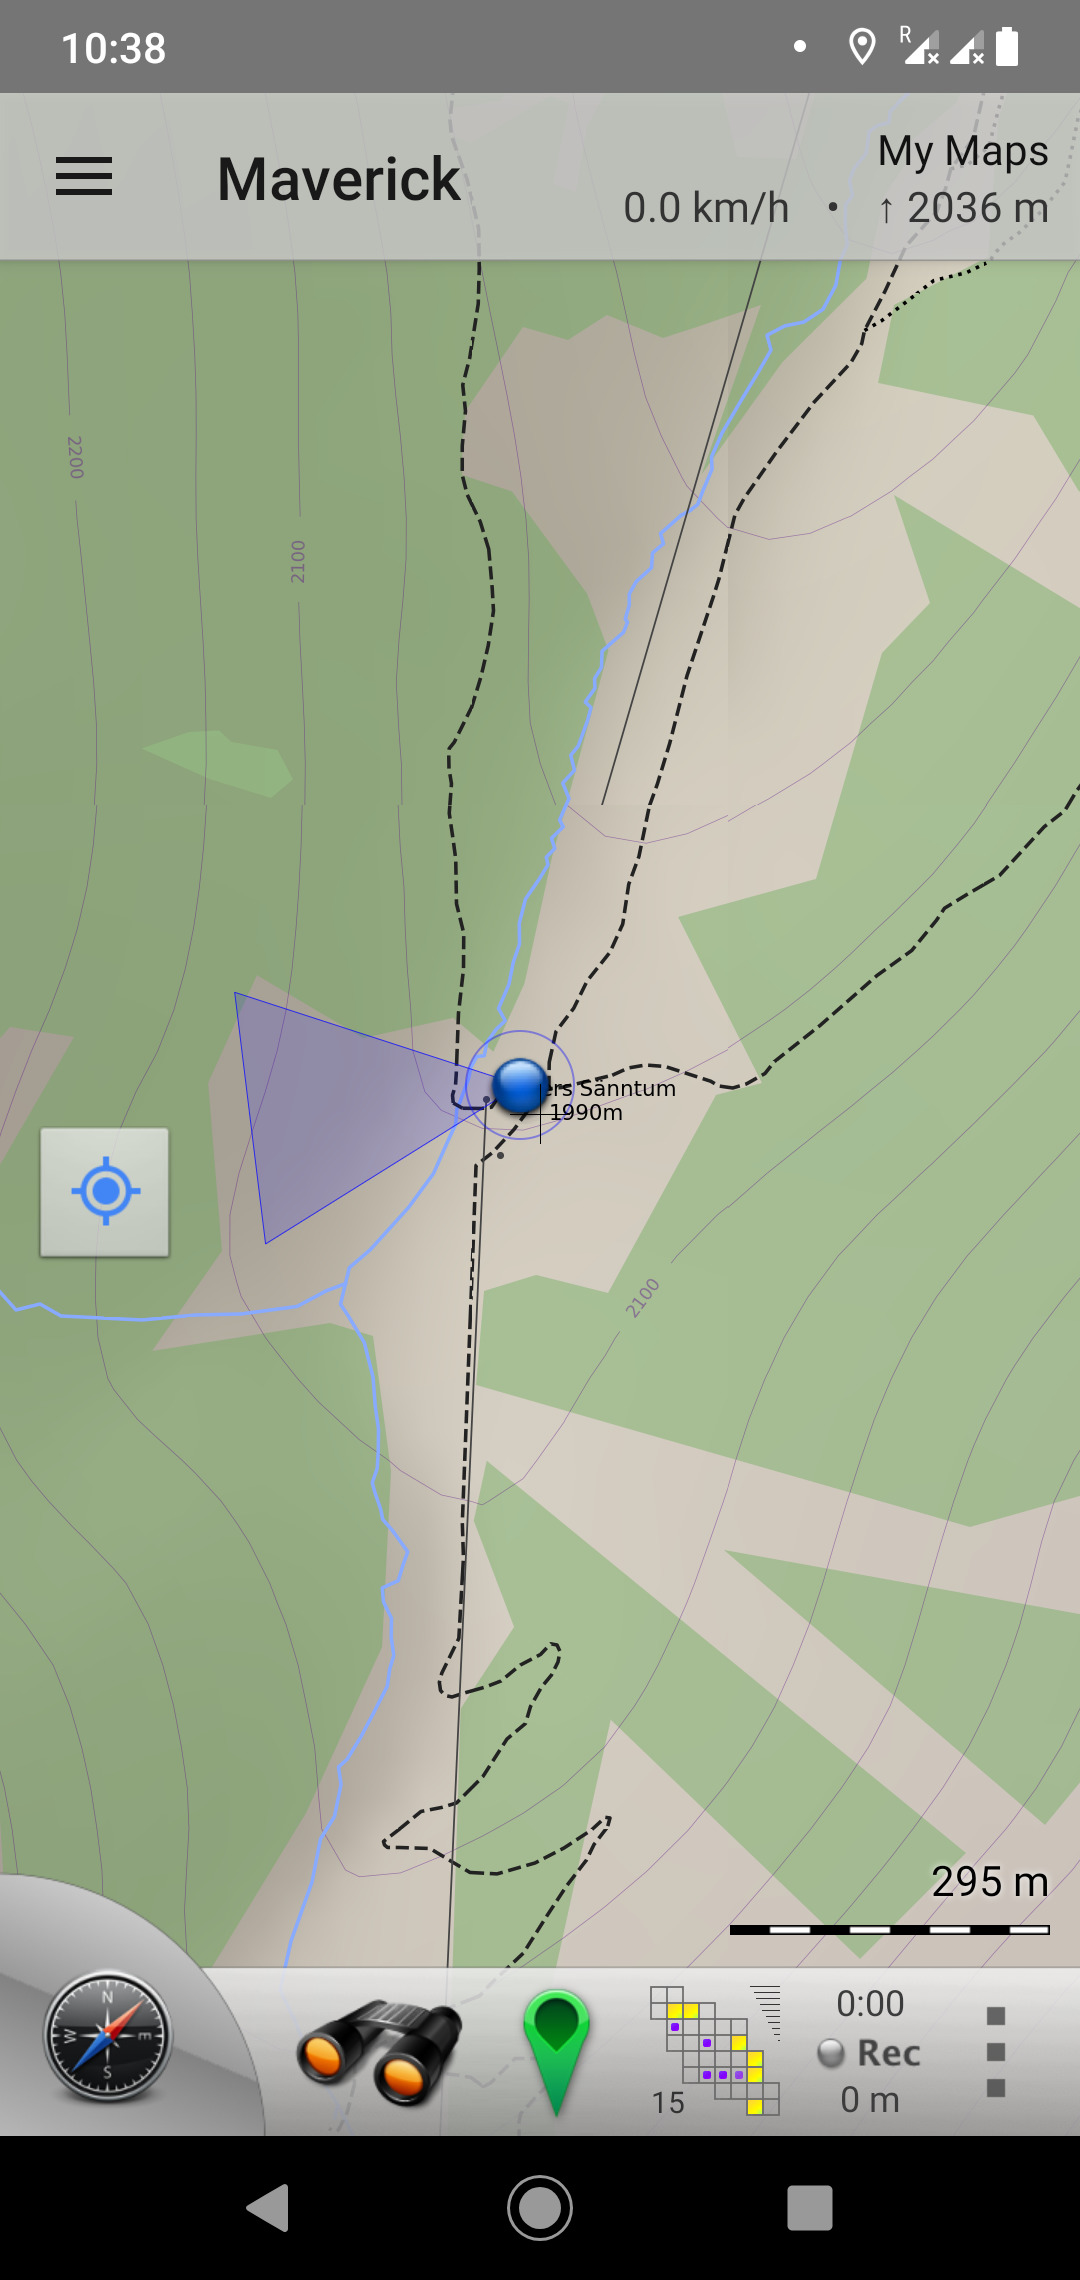
Viewing the map
Once you have some tiles, there are several apps such as Maverick which you can use to view the map on your phone. It is normally just a case of placing the tiles in the correct directory on your phone and you're done!
It is also possible to add a javascript map viewer to a webpage like the one below. There is a short tutorial to do so using leafletjs.
Download
You can download the files used to create this tutorial.
The archive contains the main script tutorial.py, a more complete OSM parser parse.py, a more complete collection of styles styles.py, the Swiss Federal Office of Topography DHM200 elevation data converted to lat/lon coordinates DHM200.txt and an empty folder tiles/ where the tiles will be saved.
If you run the tutorial as is, to create the map of Montreux, then it should look like this.